
Business Intelligence
Dashboards That Drive Decisions, Not Just Display Data
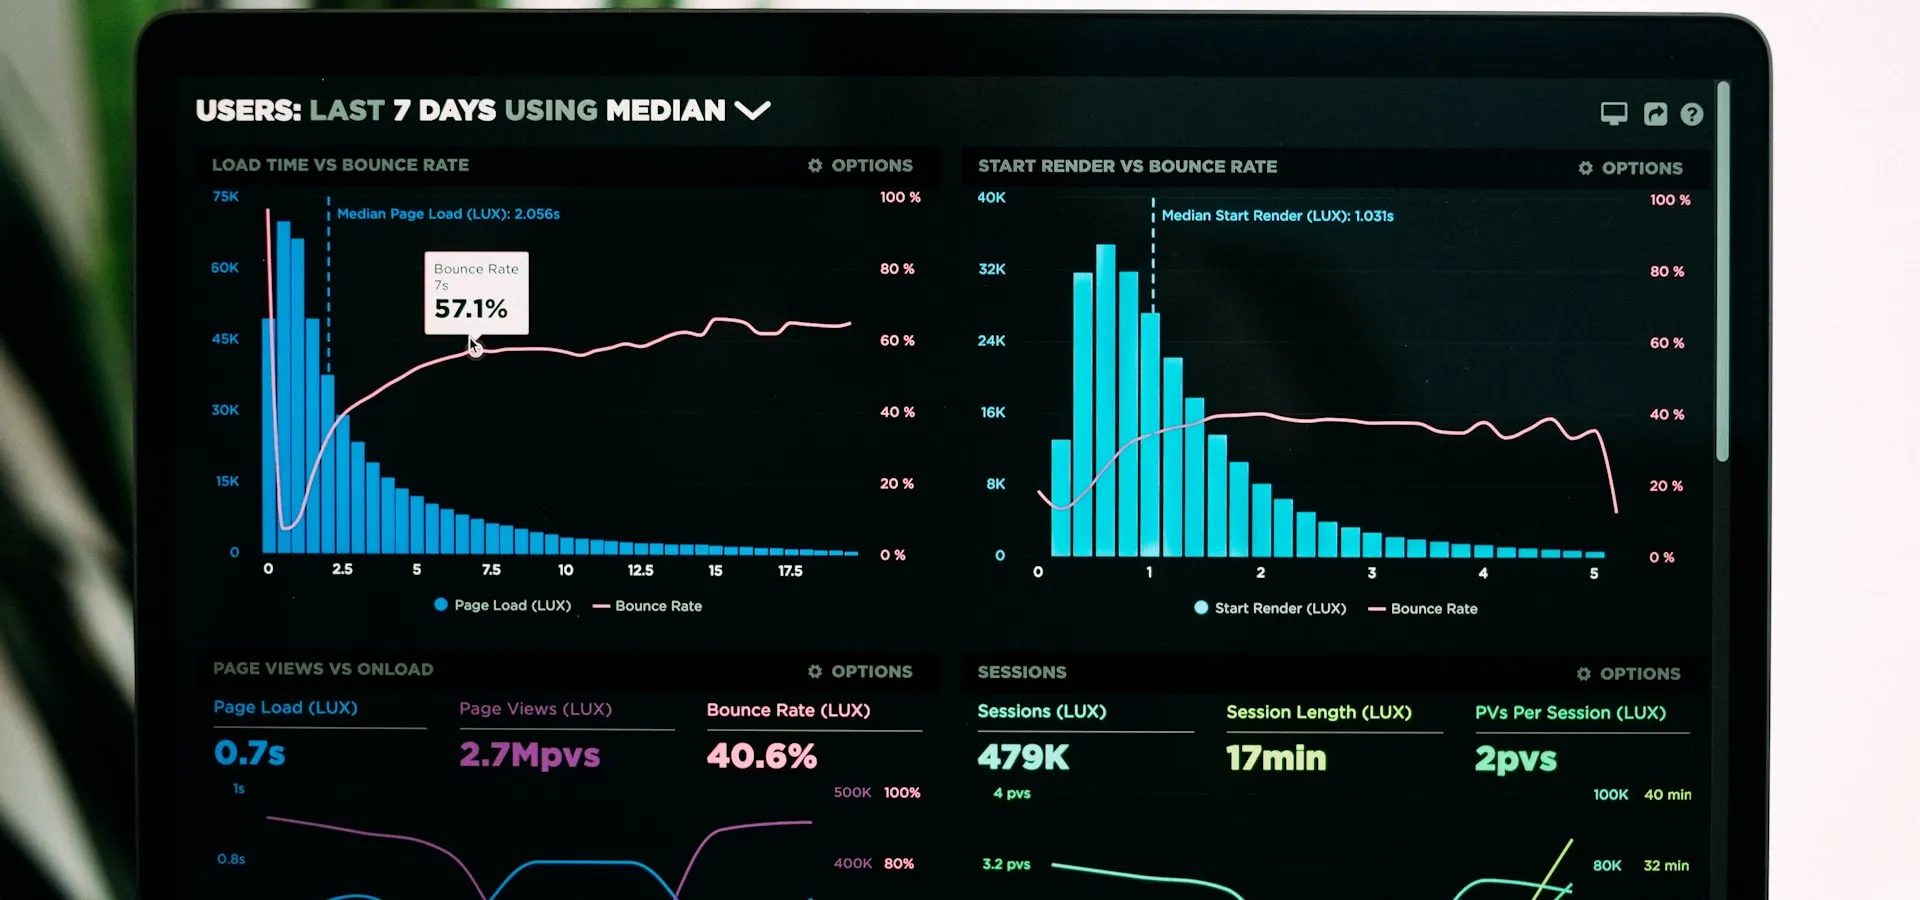
We build interactive BI dashboards and self-service reporting tools that give every stakeholder clear, real-time visibility into the metrics that matter — connected to your live data sources, not static spreadsheets.
< 2s
Dashboard Load Time
100%
Live Data Sources
80%
Reduction in Manual Reporting
5×
Faster Business Insights
Business Intelligence That Drives Decisions, Not Just Reports
Most BI implementations produce dashboards that get looked at once and forgotten. Data is pulled from one system, aggregated into a chart, and sent to an inbox that nobody opens. The issue is not the data — it is that the insight is not connected to a decision anyone needs to make.
We design BI platforms around the specific decisions your leadership, operations, and commercial teams make every day. Every metric on every dashboard exists because someone acts on it — not because it was easy to build. We connect data from your ERP, CRM, e-commerce platform, marketing tools, and financials into a single, consistent view of business performance.
Our BI builds include a semantic layer that ensures everyone in the organisation is working from the same definitions. Revenue, margin, customer, and retention mean the same thing in every report, every dashboard, for every user — eliminating the "which number is right?" conversations that waste executive time.
- Decision-first design — every dashboard built around a specific business action
- Unified data model across ERP, CRM, e-commerce, and marketing systems
- Semantic layer — consistent metric definitions across every report
- Self-service analytics with governed access — no more waiting for a data analyst
< 2s
Dashboard Load Time
Business Intelligence Capabilities
A complete suite — from initial workflow mapping through to production deployment and ongoing optimisation.
Executive Dashboards
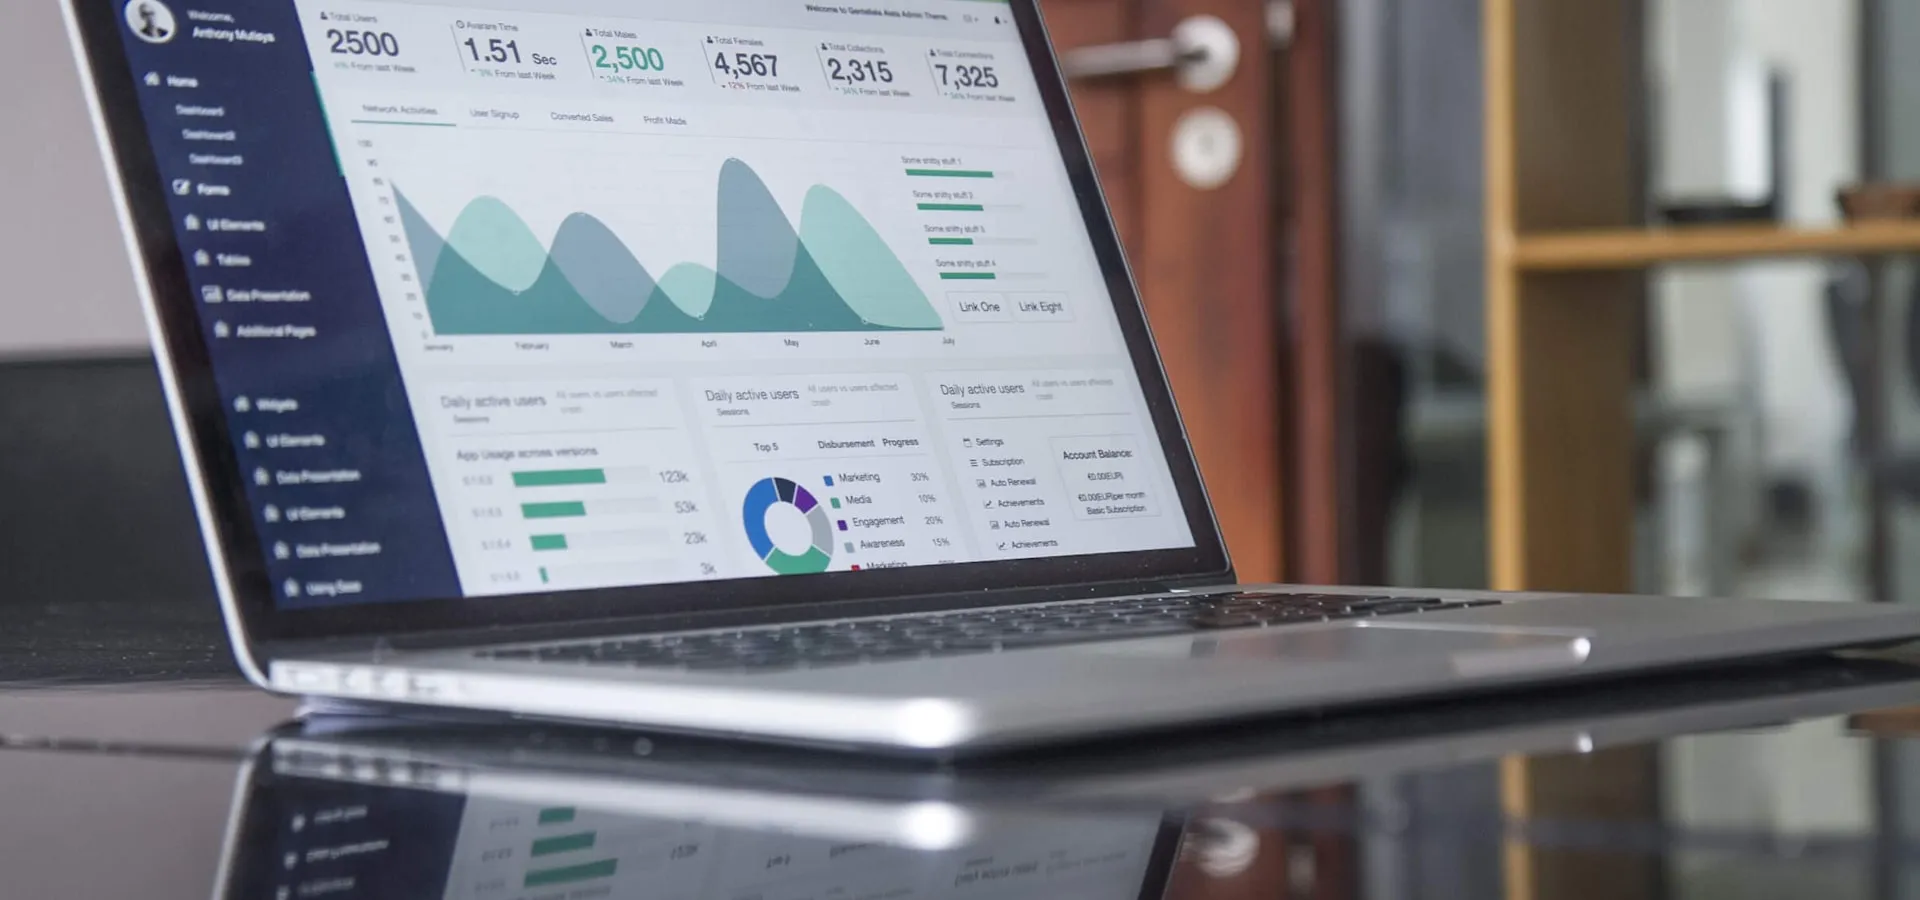
C-suite and leadership dashboards with KPIs, trends, and alerts — accessible on desktop and mobile.
Data Warehouse & Lakehouse Setup
Modern data warehouse architecture that consolidates all your business data for fast, reliable analytics.
Multi-Source Data Integration
Connect CRM, ERP, marketing platforms, and databases into a unified analytics data layer.
Self-Service Reporting Tools
Power BI, Looker, or Metabase implementations enabling business users to build their own reports.
Data Governance & Security
Row-level security, audit logging, and access controls ensuring compliant data access across your organisation.
Embedded Analytics
BI dashboards embedded directly into your product or internal tools for in-context data visibility.
Use Cases in Production
Real deployment patterns — the specifics vary per client, but the structure stays the same.
 Retail
Executive Performance Dashboard
A £90M retail group's CEO was receiving 14 separate weekly reports from finance, operations, marketing, and merchandising — all with different numbers, different definitions of "sales", and no single source of truth. Board meetings began with 20 minutes reconciling figures.
A unified executive dashboard built on a central data warehouse integrating 9 source systems. Real-time P&L by channel, region, and category. Automated weekly CEO briefing — one number, one definition, delivered to mobile before the Monday stand-up.
- Board prep time reduced from 3 hours to 20 minutes
- Single version of truth adopted across all departments
- CEO able to identify margin erosion 3 weeks earlier than previous reporting cycle
 B2B Sales
Sales Pipeline Analytics Platform
A B2B company's sales director had no real-time view of pipeline health. CRM data was unreliable, stage definitions were inconsistent across the team, and forecasting was based on gut feel. Miss rates were running at 40%.
A sales analytics layer built on Salesforce data with a clean semantic model enforcing consistent stage definitions. Pipeline coverage ratio, weighted forecast, velocity by rep and territory, and deal health scoring — all in a single Tableau dashboard.
- Forecast accuracy improved from 60% to 84% within two quarters
- Pipeline coverage gaps identified 6 weeks earlier per quarter
- Rep coaching conversations shifted from anecdote to data
 Operations
Operational KPI Platform for a Logistics Group
A logistics company with 12 depots had no consistent way to compare operational performance across sites. Each depot manager reported differently. Head office could not identify which sites were underperforming or benchmark best practices.
A standardised operational BI platform with consistent KPI definitions across all 12 depots — on-time delivery, vehicle utilisation, cost per delivery, driver performance, and customer satisfaction. Depot managers self-serve; head office has cross-site benchmarking.
- Bottom-quartile depots identified and improvement plans actioned within 60 days
- Best practice sharing between depots drove 11% average on-time delivery improvement
- Head office reporting time reduced by 8 hours per week per analyst
Why Choose Us for Business Intelligence

Real-Time Visibility
Live dashboards connected to your data sources — no more waiting for end-of-month reports that are already stale.
Self-Service Analytics
Non-technical users explore data and build their own views without needing an analyst for every question.
Unified Data View
All your data sources — CRM, ERP, e-commerce, marketing — brought together into a single analytics layer.
Role-Based Access
Granular permissions ensure each team sees only the data relevant to their function and authority level.
Our Delivery Process
A structured path from business process discovery through to live deployment and continuous improvement.
Requirements & Data Audit
Map the key questions each stakeholder needs answered, identify data sources, and assess data quality.
Data Architecture Design
Design the data warehouse schema, ETL pipelines, and analytics layer for your reporting needs.
Dashboard Build & Testing
Develop dashboards, reports, and self-service tools with stakeholder review at each stage.
Deploy & Enable
Production deployment, user training, access configuration, and ongoing dashboard maintenance.
Industries We Serve
Technologies We Use
Industry-proven tools chosen for performance, reliability, and long-term support.
 Python
 AWS
AWS React
React Docker
Frequently Asked Questions
Ready to Build Something Great?
Let's turn your idea into a product. Book a free 30-minute discovery call with our team — no commitment, just clarity.